Choosing a dip coating supplier can shape a product’s appearance, durability, and production consistency. A smooth finish may look convincing under showroom lights, yet reveal thin spots around edges or trapped bubbles after use. That is why supplier selection should involve more than comparing prices or reviewing polished photos. The right partner can explain its process clearly and show how it checks finished parts.
Start with your part’s material, dimensions, intended environment, and required coating thickness. Ask how the supplier prepares surfaces, controls bath conditions, and handles complex shapes. Request relevant quality records, inspection methods, and examples of similar work. Small details matter. A supplier should also discuss realistic lead times, minimum quantities, packaging, and what happens when a batch falls outside agreed specifications.
A dependable supplier welcomes technical questions and can explain where its capabilities have limits. Discuss tolerances early, especially when coating changes fit between close-tolerance components. If parts face moisture, abrasion, or repeated handling, ask what testing supports the supplier’s performance claims. A sample run can reveal practical issues before larger production begins. Still, a sample may not represent every production condition. No checklist can remove all uncertainty, and that deserves honest consideration. Compare written specifications, sample quality, communication, and total costs together. Keep records of agreed requirements and review the first production batch carefully. The best choice is not always the cheapest or most impressive at first glance; it is the supplier whose process fits your needs and whose claims you can verify.
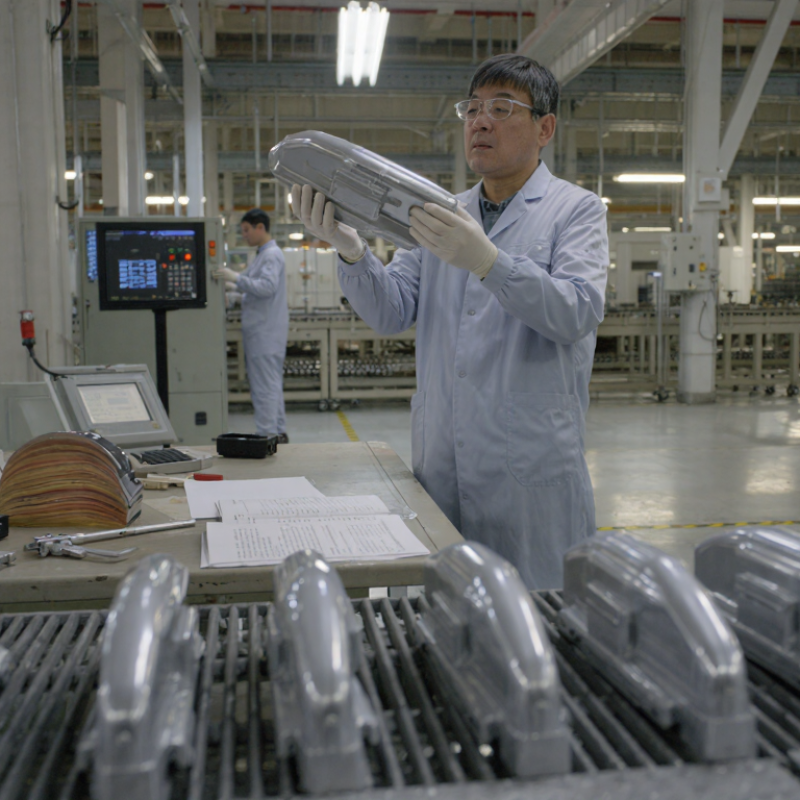
Define Substrate, Coating Chemistry, and Target Film Thickness Using ISO 2808
Before requesting a quote, identify the exact substrate: carbon steel, aluminum, or a polymer part. Surface condition matters too. Note oils, oxide, roughness, sharp edges, and cleaning limits. Ask the supplier to confirm that the coating chemistry suits both the substrate and its service environment. A salt-spray result alone does not guarantee service life.
Set a target dry-film thickness and an acceptable range. ISO 2808 describes methods for measuring coating thickness; it does not prescribe one universal target. Agree on the measurement method, sampling locations, and reporting format before production. This helps prevent comparisons between readings taken by different methods. The NACE IMPACT study estimated global corrosion costs at US$2.5 trillion annually, or about 3.4% of global GDP (2016). That figure highlights the value of coating control, but cannot predict performance for a specific part.
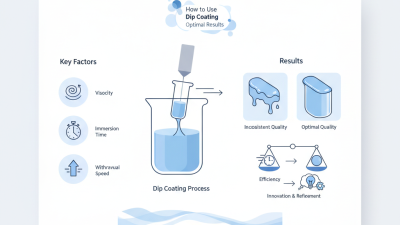
Tips: Send a drawing, substrate sample, and exposure details. Request trial parts with readings from edges and recesses. Ask how bath temperature, withdrawal speed, and drainage are monitored. Small parts can look uniform yet hide thin spots. Specifications often leave this detail vague; clarify it before approval. Then review test records and agree on how out-of-range readings will be handled.
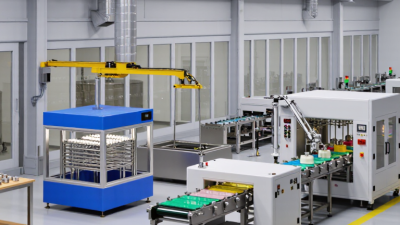
How to Choose a Dip Coating Supplier?
Review Process Control: LLD Film Thickness Scales with Withdrawal Speed to the 2/3 Power
A dip-coating supplier should explain how withdrawal speed affects wet-film thickness, not just quote a target. The Landau–Levich analysis, published in 1942 in Acta Physicochimica URSS, predicts thickness proportional to withdrawal speed raised to the 2/3 power. For a Newtonian liquid at low capillary number, the relation is approximately h = 0.94 × capillary length × Ca^(2/3). Here, Ca depends on viscosity, speed, and surface tension.
This gives a useful process check. If withdrawal speed doubles, predicted wet-film thickness rises by about 59%, assuming bath properties and temperature stay constant. That matters. Ask suppliers for trial data showing speed alongside measured thickness, bath temperature, viscosity, and repeatability. A graph is more useful than a single “standard” setting; request results from several runs, including the slow and fast ends of the operating range.
The model is not a guarantee. Drainage, evaporation, geometry, and non-Newtonian behavior can shift real results. A careful supplier should flag those limits and show how measurements were taken. Compare their records with your own part dimensions and acceptance criteria. Small differences matter. I would also ask whether they track bath age, since it is easy to overlook during a busy production run.
Model-based example for reviewing withdrawal-speed control. The predicted wet-film thicknesses below are calculated using the Landau–Levich–Derjaguin relation; they are not measured supplier results.
| Withdrawal speed (mm/s) | Capillary number, Ca | Predicted wet-film thickness (µm) | Thickness relative to 1 mm/s | Supplier process-control review |
|---|---|---|---|---|
| 1 | 0.00050 | 12.0 | 1.00× | Request the speed setpoint, actual speed trace, and instrument calibration record. |
| 2 | 0.00100 | 19.0 | 1.59× | Check that the withdrawal-speed ramp and start/stop sequence are documented. |
| 4 | 0.00200 | 30.0 | 2.51× | Review run-to-run speed records and the method used to verify film thickness. |
| 8 | 0.00400 | 47.8 | 4.00× | Confirm bath temperature and viscosity are recorded alongside each coating run. |
| 12 | 0.00600 | 62.7 | 5.24× | Ask for thickness-uniformity results across the coated area and the sampling plan. |
| 16 | 0.00800 | 75.9 | 6.35× | Check whether the operating range has been validated for the specified liquid and substrate. |
Model basis: h ≈ 0.94 lc Ca2/3, where Ca = µU/γ and lc = √(γ/ρg).
Illustrative input conditions: dynamic viscosity µ = 0.020 Pa·s; surface tension γ = 0.040 N/m; liquid density ρ = 1,000 kg/m³; gravitational acceleration g = 9.81 m/s².
Interpretation: The 2/3-power relationship is an idealized estimate for a Newtonian liquid in the low-capillary-number dip-coating regime. Actual film thickness can differ due to evaporation, drainage, non-Newtonian behavior, substrate wetting, and other process conditions. Verify performance using agreed measurement methods and production-representative trials.
Verify Adhesion Using ASTM D3359’s 0–5B Classification Scale
A supplier’s adhesion claim is more useful when it comes with a documented test result. For many coated panels, ASTM D3359 Method B uses a cross-cut pattern and pressure-sensitive tape. Its scale runs from 0B to 5B. At 5B, no coating squares are detached; at 0B, more than 65 percent is removed. The middle ratings describe increasing coating loss. Small differences matter.
Ask which method was used, and whether the test panel matched your part’s substrate, surface preparation, coating thickness, and cure. Request the rating, test date, and relevant conditions in the report. A polished sample can look convincing. The record tells you more. Still, this test is a snapshot, not proof of long-term durability under abrasion, moisture, or temperature changes.
Tips: Compare suppliers using equivalent panels and test conditions. Check that the report names ASTM D3359 Method B, rather than simply stating “passed.” If a rating seems inconsistent, ask for a repeat test and discuss the result openly. A perfect score is useful, but it is not the whole story.
Ask how a dip coating supplier’s quality system works on the shop floor, not just whether a certificate is displayed. ISO 9001:2015 certification signals a managed system, but it cannot guarantee every coated batch meets your drawing. Request the certificate’s current scope and recent audit findings, if available. Then trace one job from purchase order to shipment. Can staff show controlled work instructions, inspection records, and approved changes? Small details matter. A dated bath log or signed first-article check can show whether procedures are followed consistently.
Traceability should link incoming material, coating conditions, inspection results, and final packing to one lot or job number. Ask the supplier to retrieve a sample record while you watch. Is the substrate identified? Are dip or cure parameters recorded with dates, equipment IDs, and operator initials? Can a nonconforming part be isolated without searching through piles of paperwork? Look closely. A clean spreadsheet is not enough if entries are added days later. Audits sometimes focus on forms and miss hurried handoffs. Ask how staff handle process deviations, who approves rework, and how affected parts are contained. Some records may look incomplete at first glance; ask for context rather than assuming the worst. Evidence should be timely, consistent, and easy to connect to the actual part.
How to Choose a Dip Coating Supplier?
A supplier’s pilot should resemble your real production conditions, not a polished demonstration. Send representative parts, including awkward shapes, edges, and recessed areas. Agree on coating thickness, cure settings, and inspection methods before the trial begins. Then compare adhesion, coverage, appearance, and cycle time across several runs. Small details matter. A single flawless part proves little; ask for results from a repeatable batch. Record what failed, too. A few bubbles or thin spots may reveal more than a perfect sample.
Capacity needs evidence beyond a stated monthly volume. Ask how many parts the line can process at your required geometry and schedule, and identify bottlenecks such as drying space, fixture availability, or changeovers. Compare defect rates using the same definitions and sample sizes. Request records for rework, scrap, and inspection—not just the headline pass rate. Even a careful comparison has blind spots. A spreadsheet may miss the cost of a delayed order or extra handling. Total cost of ownership should include coating, preparation, masking, freight, quality checks, rework, and downtime. The lowest quote may not be the lowest-cost option. Check assumptions with your own production team before deciding.
Compare pilot results, production capacity, defect rates, and total cost of ownership before making a decision.
Illustrative comparison only—not verified supplier or industry data. Use your own pilot runs, quotes, and quality records to build a purchasing decision.
| Evaluation metric | Option A | Option B | Option C |
|---|---|---|---|
| Pilot first-pass yield | 96.8% | 98.1% | 97.4% |
| Estimated monthly capacity (parts) | 120,000 | 80,000 | 200,000 |
| Defect rate | 1.8% | 0.9% | 1.3% |
| Estimated total cost per 1,000 parts | $42 | $47 | $39 |
A strong choice balances consistent pilot yield and low defects with enough capacity for forecast demand. Compare total cost of ownership—including inspection, rework, scrap, logistics, and process changes—not just the quoted coating price.